Metrics
In addition to the reports and charts built in to the Supabase dashboard, each project hosted on the Supabase platform comes with a Prometheus-compatible metrics endpoint, updated every minute, which can be used to gather insight into the health and status of your project.
You can use this endpoint to ingest data into your own monitoring and alerting infrastructure, as long as it is capable of scraping Prometheus-compatible endpoints, in order to set up custom rules beyond those supported by the Supabase dashboard.
The endpoint discussed in this article is in beta, and the metrics returned by it might evolve or be changed in the future to increase its utility.
The endpoint discussed in this article is not available on self-hosted.
Accessing the metrics endpoint
Your project's metrics endpoint is accessible at https://<project-ref>.supabase.co/customer/v1/privileged/metrics.
Access to the endpoint is secured via HTTP Basic Auth:
- username:
service_role - password: the
service_roleAPI key or any other secret API key, get these from Supabase dashboard
You can also retrieve your service role key programmatically using the Management API:
1234567# Get your access token from https://supabase.com/dashboard/account/tokensexport SUPABASE_ACCESS_TOKEN="your-access-token"export PROJECT_REF="your-project-ref"# Get project API keys including service_role keycurl -H "Authorization: Bearer $SUPABASE_ACCESS_TOKEN" \ "https://api.supabase.com/v1/projects/$PROJECT_REF/api-keys?reveal=true"Project URL
12curl <project-url>/customer/v1/privileged/metrics \ --user 'service_role:sb_secret_...'12curl <project-url>/customer/v1/privileged/metrics \ --user 'service_role:<service-role-jwt>'Supabase Grafana
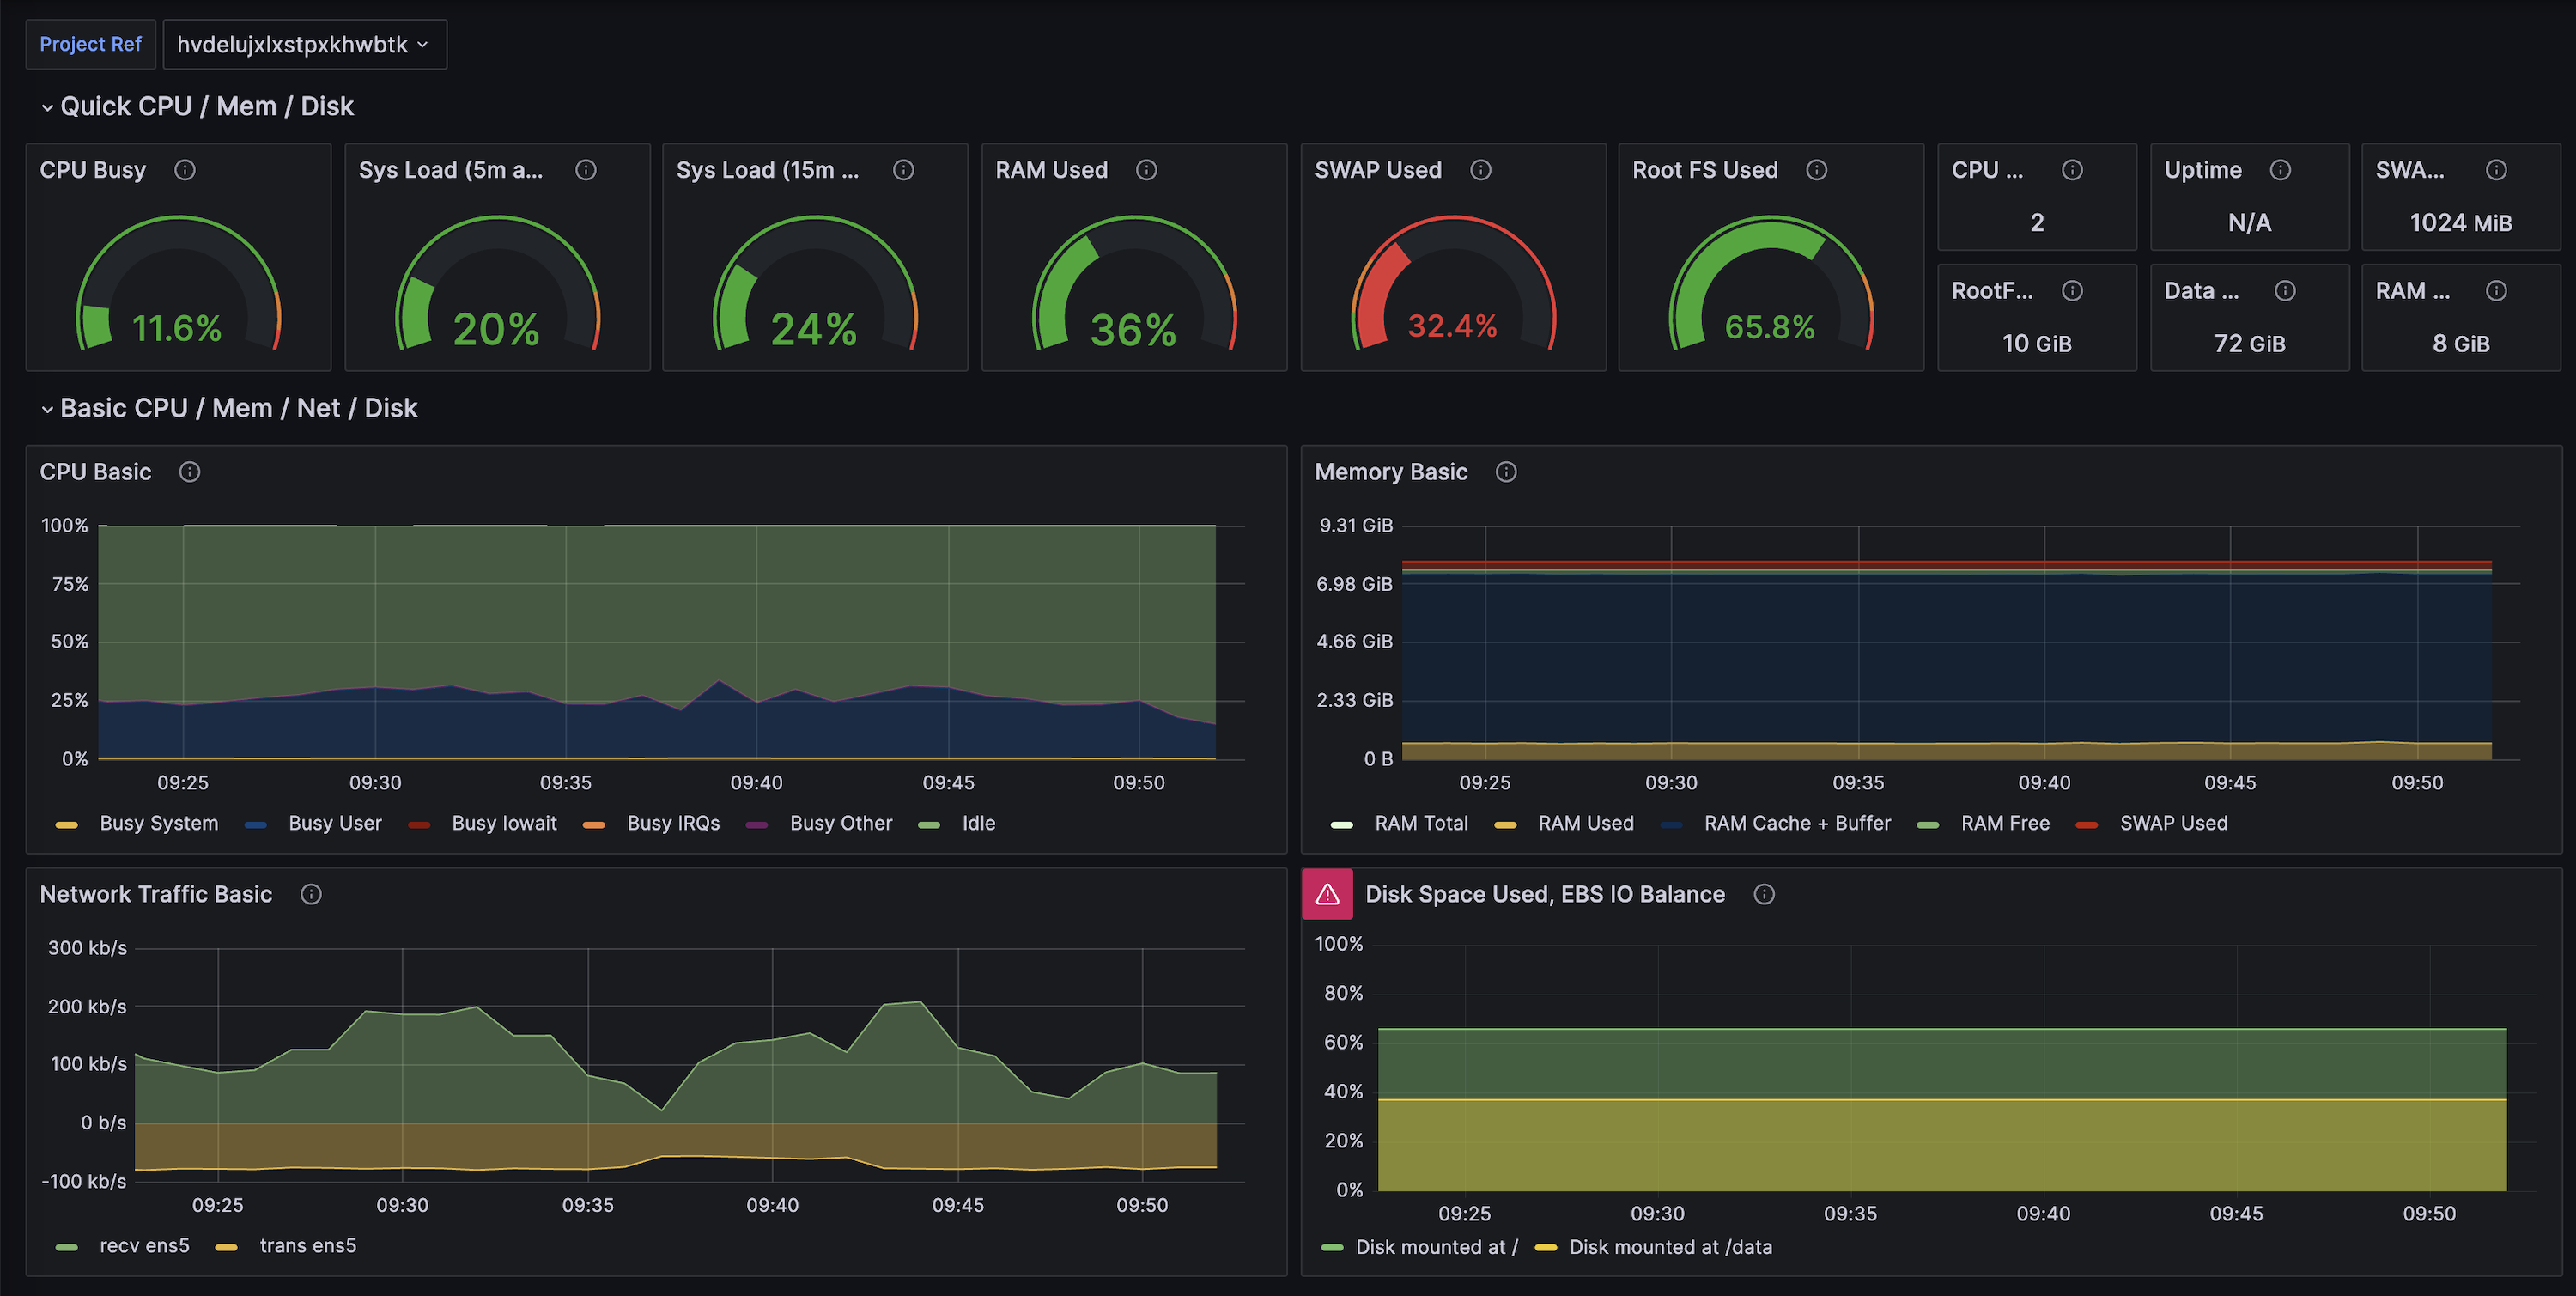
The pre-configured Supabase Grafana Dashboard is an advanced version of the Dashboard's Database Reports. It visualizes over 200 database performance and health metrics.
Instructions are included in the README for deploying the repository using docker.
Using the metrics endpoint in production
To set up monitoring for your project, you will need two things:
- A datastore - a place to store the metrics coming from your Supabase project over time
- A dashboard - a place to visualize the state of your Supabase project for a defined period
Setting up a metrics datastore
One of the more well-known options is Prometheus and it is the tool used in this guide.
You can self-host Prometheus or choose a managed service to store your metrics. Some of the providers offering managed Prometheus are:
Follow the guides for the deployment option you choose
Adding a scrape job to Prometheus
For Prometheus, modify your prometheus.yaml file to add a Supabase job, and set the metrics_path, scheme, basic_auth and targets parameters. For example:
12345678910111213scrape_configs: - job_name: "MySupabaseJob" metrics_path: "/customer/v1/privileged/metrics" scheme: https basic_auth: username: "service_role" password: "<your service_role JWT>" static_configs: - targets: [ "<your Supabase Project ID>.supabase.co:443" ] labels: group: "MyGroupLabel"Setting up a dashboard
For this guide, we will be using Grafana.
You can self-host Grafana or many providers offer managed Grafana, some of which are listed below:
Follow the guides of the provider you choose to get Grafana up and running.
Adding a data source to Grafana
In the left-hand menu, select Data sources and click Add new data source.
Select Prometheus and enter the connection details for the Prometheus instance you have set up.
Under Interval behavior, set the scraping interval to 60s and test the data source. Once it has passed, save it.
Adding the Supabase dashboard
In the left-hand menu, select Dashboards and click New. From the drop-down, select Import.
Copy the raw file from our supabase-grafana repository and paste it (or upload the file).
Click Load and the dashboard will load from the project specified in your Prometheus job.
Monitoring your project
You can configure alerts from Prometheus or Grafana. The supabase-grafana repository has a selection of example alerts that can be configured.
Grafana Cloud has an unofficial integration for scraping Supabase metrics. See their docs for instructions on how to configure it but note that it is not full-featured nor is it supported by Supabase.